
Small-object concurrency scaling on Optane: Goblin Store versus Vinyl Cache
On July 19, 2026, we compared Goblin Store and Vinyl Cache on a 373,165-object HTTP workload while sweeping 16 through 1,024 concurrent persistent connections. Both caches ran on the 12-core NUMA node directly attached to an Intel Optane SSD 900P. An io_uring load generator occupied the other three NUMA nodes, giving it 36 physical cores and enough capacity to keep pressure on either server.
Goblin Store was faster at every tested concurrency. It peaked at 54.106 Gbit/s, 14.1% above Vinyl’s peak of 47.402 Gbit/s, and retained an 18.5% advantage at concurrency 1,024. Across the seven points its aggregate-throughput advantage averaged 16.0%. Starting from an empty application cache, Goblin populated at 18.614 Gbit/s versus Vinyl’s 9.142 Gbit/s: 2.04 times the bandwidth and 50.9% less elapsed time.
| Characteristic result | Vinyl Cache | Goblin Store | Goblin advantage |
|---|---|---|---|
| Peak warmed throughput | 47.402 Gbit/s at C64 | 54.106 Gbit/s at C128 | 14.1% |
| Warmed throughput at C1024 | 40.944 Gbit/s | 48.509 Gbit/s | 18.5% |
| Empty-cache population | 9.142 Gbit/s | 18.614 Gbit/s | 103.6% |
This is a small-object concurrency and cache-throughput test over local TCP loopback. It was a local test and did not involve a network card. It is also one complete run per cache, not a replicated statistical study.
Goblin Store speaks memcache over TCP or native InfiniBand RDMA, and HTTP as either a server or a caching proxy. This experiment exercises only its HTTP caching-proxy path.
The small-object workload
The access pattern is derived from the Encrypted Web Traffic Dataset: Event Logs and Packet Traces. One event-log-derived source file listed host names and associated sizes in access order. We mapped the names to opaque numeric object IDs and generated random, incompressible payload files at the assigned sizes. The benchmark does not serve the original host names or captured packet payloads.
Two manifests describe the resulting workload:
- The population manifest contains every numeric object ID once. It is used to fill an empty cache completely.
- The measured manifest retains the source access order, including repeated IDs. Every cache and concurrency point replays this exact 6,141,630-row sequence.
| Corpus property | Value |
|---|---|
| Unique objects | 373,165 |
| Generated payload | 66,693,472,653 bytes / 62.113 GiB |
| Mean object size | 178,724 bytes / 174.5 KiB |
| Median object size | 26,890 bytes / 26.3 KiB |
| 90th-percentile object size | 192,477 bytes / 188.0 KiB |
| 99th-percentile object size | 2,615,760 bytes / 2.495 MiB |
| Largest object | 157,403,824 bytes / 150.1 MiB |
| Objects no larger than 2 KiB | 18,466 |
| Objects no larger than 256 KiB | 343,728 / 92.11% |
| Measured requests per concurrency point | 6,141,630 |
| Measured payload per concurrency point | 285,757,364,203 bytes / 266.132 GiB |
The distribution has a long tail, but its center is small: half the objects are below 27 KiB and 90% are below 193 KiB. With Goblin’s 256 KiB head, 6,014,281 measured accesses—97.93% of the trace—refer to objects that fit entirely in their resident head or packed small-object slot. The remaining accesses exercise the Optane-tail path.
Hardware and NUMA layout
The experiment used one Dell PowerEdge R820. The cache server and load generator were separate processes on disjoint NUMA CPU sets in the same machine.
| Component | Configuration |
|---|---|
| System | Dell PowerEdge R820, BIOS 2.7.0 |
| CPU | 4 x Intel Xeon E5-4657L v2 at 2.40 GHz |
| CPU topology | 12 cores/socket, 48 physical cores, 96 logical CPUs |
| CPU caches | 1.5 MiB L1d, 1.5 MiB L1i, 12 MiB L2, 120 MiB L3 total |
| RAM | 48 x 32 GiB DIMMs; 1.5 TiB installed, 1.476 TiB reported usable |
| NUMA | Four nodes, one per socket, approximately 378 GiB each |
| Kernel | Linux 5.15.0-157-generic, Ubuntu build #167 |
| Cache device | Intel Optane SSD 900P, model INTEL SSDPED1D960GAY |
| Optane firmware / PCI | E2010435; Intel 8086:2700 at 0000:04:00.0 |
| Optane locality | NUMA node 0 |
| Cache filesystem | XFS on /dev/nvme0n1, mounted at /mnt/local |
| XFS geometry | 4 KiB blocks, four allocation groups, internal log |
| Filesystem capacity | 959,728,279,552 bytes / 894 GiB |
Linux reports the node-0 NUMA cost row as 10/20/30/20. These are relative communication costs:
local access starts at 10 and every inter-node grid hop adds 10. Nodes 1 and 3 are therefore one
hop from the server at a reported cost of 20, while node 2 is two hops away at a cost of 30.
node 0 [server + Optane 900P] -- +10/hop -- node 1 [client]
               |                                  |
           +10/hop                            +10/hop
               |                                  |
node 3 [client; nginx on fill] -- +10/hop -- node 2 [client]

Reported cost = local baseline 10 + 10 per grid hop.
The cache process was confined to all 24 logical CPUs on node 0. Goblin started 12 protocol
workers, one on each physical core’s first SMT sibling (0,4,...,44); its remaining local SMT
siblings remained available to its dispatcher and background work. Vinyl received the identical
24-CPU process affinity. We did not limit Vinyl’s internal worker model: it retained its defaults
of two request pools and 200 request-worker threads.
The client was excluded from node 0. Its CPU mask contained all 72 logical CPUs on nodes 1, 2,
and 3, representing 36 physical cores. Its task, object, and result memory used
--interleave=1,2,3, so client allocation could not consume server-local node-0 memory.
Client design
The benchmark client is a purpose-built C++20 HTTP/1.1 load generator using one io_uring instance per active client thread. It keeps one request in flight on each persistent connection and starts the connection’s next request immediately after receiving the declared response body.
The number of event loops is min(concurrency, 72):
| Offered concurrency | Client io_uring loops | Placement |
|---|---|---|
| 16 | 16 | 16 physical cores across client nodes |
| 32 | 32 | 32 physical cores across client nodes |
| 64 | 64 | All 36 physical cores, then SMT siblings |
| 128–1,024 | 72 | All 36 physical cores and both SMT siblings |
Idle connections take the next row from one cache-line-isolated shared task queue. This matters: an earlier client assigned equal request counts to event loops even when some loops owned twice as many connections, and private stripes differed by 8.54% in payload bytes. That implementation was discarded before this experiment. The shared-queue client preserves the fixed manifest while allowing every idle connection to claim work, preventing a slow loop or an oversized stripe from becoming the tail of the entire run.
The client records nanosecond request, first-byte, and last-byte timestamps in RAM. It writes its CSV only after the measured pass, so result logging is outside the timed interval. At C1024 it created all 1,024 requested persistent connections across 72 io_uring loops. Its process-wide CPU ratio was equivalent to 10.44 logical CPUs in the Goblin C1024 result even though that accounting conservatively includes manifest setup and post-interval CSV serialization. This remained well below the client’s 36-core capacity; the load generator was not CPU-saturated.
Cache configurations
Vinyl Cache
We tested Vinyl Cache 9.0.1, revision
423648c4cb6b225b3268ffc337354ea938f5efee.
Vinyl received a fresh, fully allocated 96 GiB cache file on Optane for this run. File-cache granularity was 4 KiB with random access advice. Its VCL assigned a seven-day TTL, disabled grace and keep, and enabled streaming admission. Its normal 200 request workers ran inside the same node-0 affinity allowed to Goblin.
Goblin Store
We tested a Goblin Store 0.0.2 development working tree based on commit
e74d787316a980c6215fc3546968b38472a94213 and containing the new dispatcher and client-path work.
goblin-store --mirror http://127.0.0.1:18000 --mirror-client uring \
  --listen-address 127.0.0.1 --http-port 8080 --no-memcache --net async \
  --numa 0 --cores 12 --memory 48G --small-memory 48G \
  --block 2M --ram-head 256K --io-chunk 256K --write-io-chunk 1M \
  --no-numa-promotion --ssd-dir <fresh Optane pool>
The fixed-head and packed-small-object pools were each 48 GiB and strictly node-local. Objects smaller than a full head used the packed arena rather than consuming an entire 256 KiB slot. Before startup the runner compacted memory and requested 49,152 node-0 HugeTLB pages of 2 MiB each—96 GiB total. All 49,152 pages were obtained. NUMA promotion was disabled because all cache memory was already on the only server node used by the test.
Procedure
Each cache followed the same controlled sequence:
- Require
numadto be inactive and verify that no benchmark process or port remains. - Delete the prior cache allocation and issue
fstrimon/mnt/local. - Create a fresh cache: a fully allocated 96 GiB Vinyl file, or a new Goblin pool. Before Goblin, compact memory and reserve the node-0 HugeTLB pool described above.
- Start nginx 1.18.0 on node 3 as the loopback origin. Start the cache on node 0.
- At concurrency 32, request every one of the 373,165 generated files exactly once. Record this empty-cache population separately.
- Issue a 1,000-request hit probe. Then replay all 6,141,630 measured accesses at C16, C32, C64, C128, C256, C512, and C1024 without restarting the already-populated cache.
- Require HTTP 200 and the exact declared body length for every request. Flush and recount the nginx access log after every pass; any request reaching the origin after population invalidates the experiment.
- Record process CPU, RSS, I/O counters, VM/pressure data, and NUMA memory once per second. Goblin’s runner also records Optane temperature. Checksum every result trace after shutdown.
Each server made exactly 373,165 origin requests—the population set—and zero afterward. Every measured pass completed 6,141,630 requests with zero client failures or body-length mismatches.
“Cold cache” below means that the application cache was empty. It does not claim a cold Optane device or cold Linux page cache: the generated origin corpus and cache allocation share the Optane filesystem, and we did not drop the host page cache between the two products.
Empty-cache population
Population includes origin fetch, client delivery, and cache admission. Goblin’s native persistent io_uring origin client and its admission pipeline loaded the complete 62.113 GiB corpus in less than half Vinyl’s time.
| Cache | Requests | Elapsed | Requests/s | Payload bandwidth | Relative bandwidth | Time reduction |
|---|---|---|---|---|---|---|
| Vinyl Cache | 373,165 | 58.360 s | 6,394 | 9.142 Gbit/s | baseline | baseline |
| Goblin Store | 373,165 | 28.663 s | 13,019 | 18.614 Gbit/s | +103.6% | 50.9% |
This population comparison uses the same C32 client placement and 24-worker nginx origin. During population only, nginx shared node 3 with part of the client. The origin was idle throughout every warmed pass.
Warm-cache concurrency scaling
Every row transferred the same 266.132 GiB in the same access order. Aggregate bandwidth is payload bytes divided by the client’s complete measured interval; decimal Gbit/s is used.
| Concurrency | Client loops | Vinyl elapsed | Vinyl Gbit/s | Goblin elapsed | Goblin Gbit/s | Goblin improvement |
|---|---|---|---|---|---|---|
| 16 | 16 | 68.056 s | 33.591 | 55.084 s | 41.501 | +23.6% |
| 32 | 32 | 48.256 s | 47.374 | 44.472 s | 51.404 | +8.5% |
| 64 | 64 | 48.228 s | 47.402 | 42.292 s | 54.054 | +14.0% |
| 128 | 72 | 49.522 s | 46.163 | 42.251 s | 54.106 | +17.2% |
| 256 | 72 | 49.846 s | 45.863 | 43.145 s | 52.986 | +15.5% |
| 512 | 72 | 52.006 s | 43.958 | 45.344 s | 50.416 | +14.7% |
| 1,024 | 72 | 55.834 s | 40.944 | 47.126 s | 48.509 | +18.5% |
Vinyl reached its maximum at C64 and then declined as connection count increased. Goblin continued scaling through C128, where it peaked at 54.106 Gbit/s. It also declined beyond the knee, but more slowly: at C1024 Goblin still delivered 89.7% of its own peak, while Vinyl delivered 86.4% of its peak. The result is not one narrow win at an ideal operating point; Goblin’s advantage remained between 14.0% and 18.5% from C64 through C1024.
The shared-queue client materially changed the offered load. For example, a preceding Vinyl C32 run with the imbalanced client reached 40.166 Gbit/s; the three-node client reached 47.374 Gbit/s. Results from that earlier client are not mixed into this table.
C256 delivery-time distributions
The following plots show every request in the concurrency-256 passes: received body size on the
horizontal axis and request-to-completion time (complete_ns - query_start_ns) on the vertical
axis. Both axes are logarithmic. The vertical height of a point cloud at a given object size is
therefore a direct view of delivery-time variability for that size.
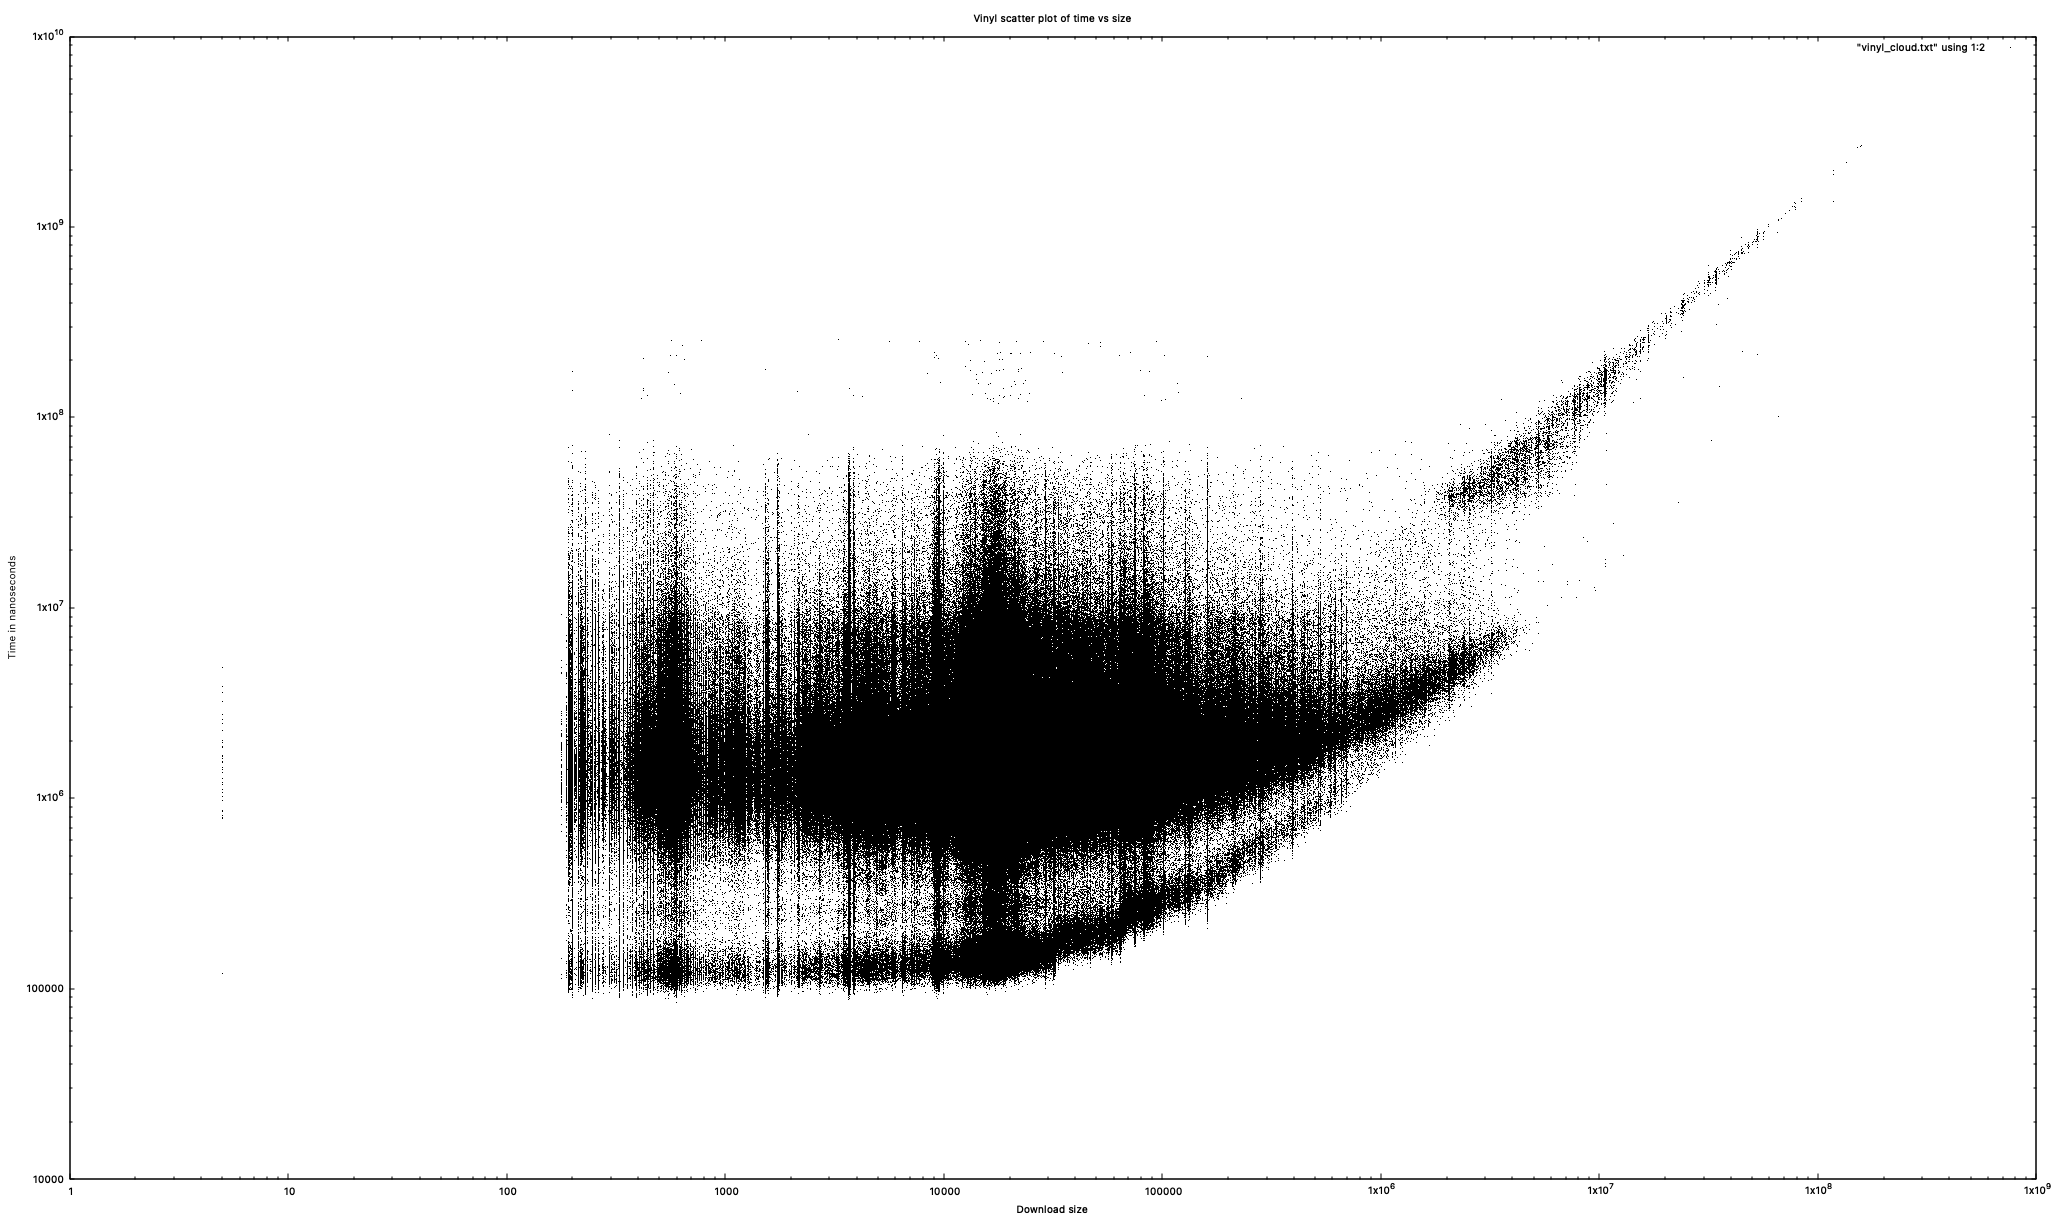
Vinyl Cache at C256. The common-size cloud is vertically broad, with a pronounced right tail.
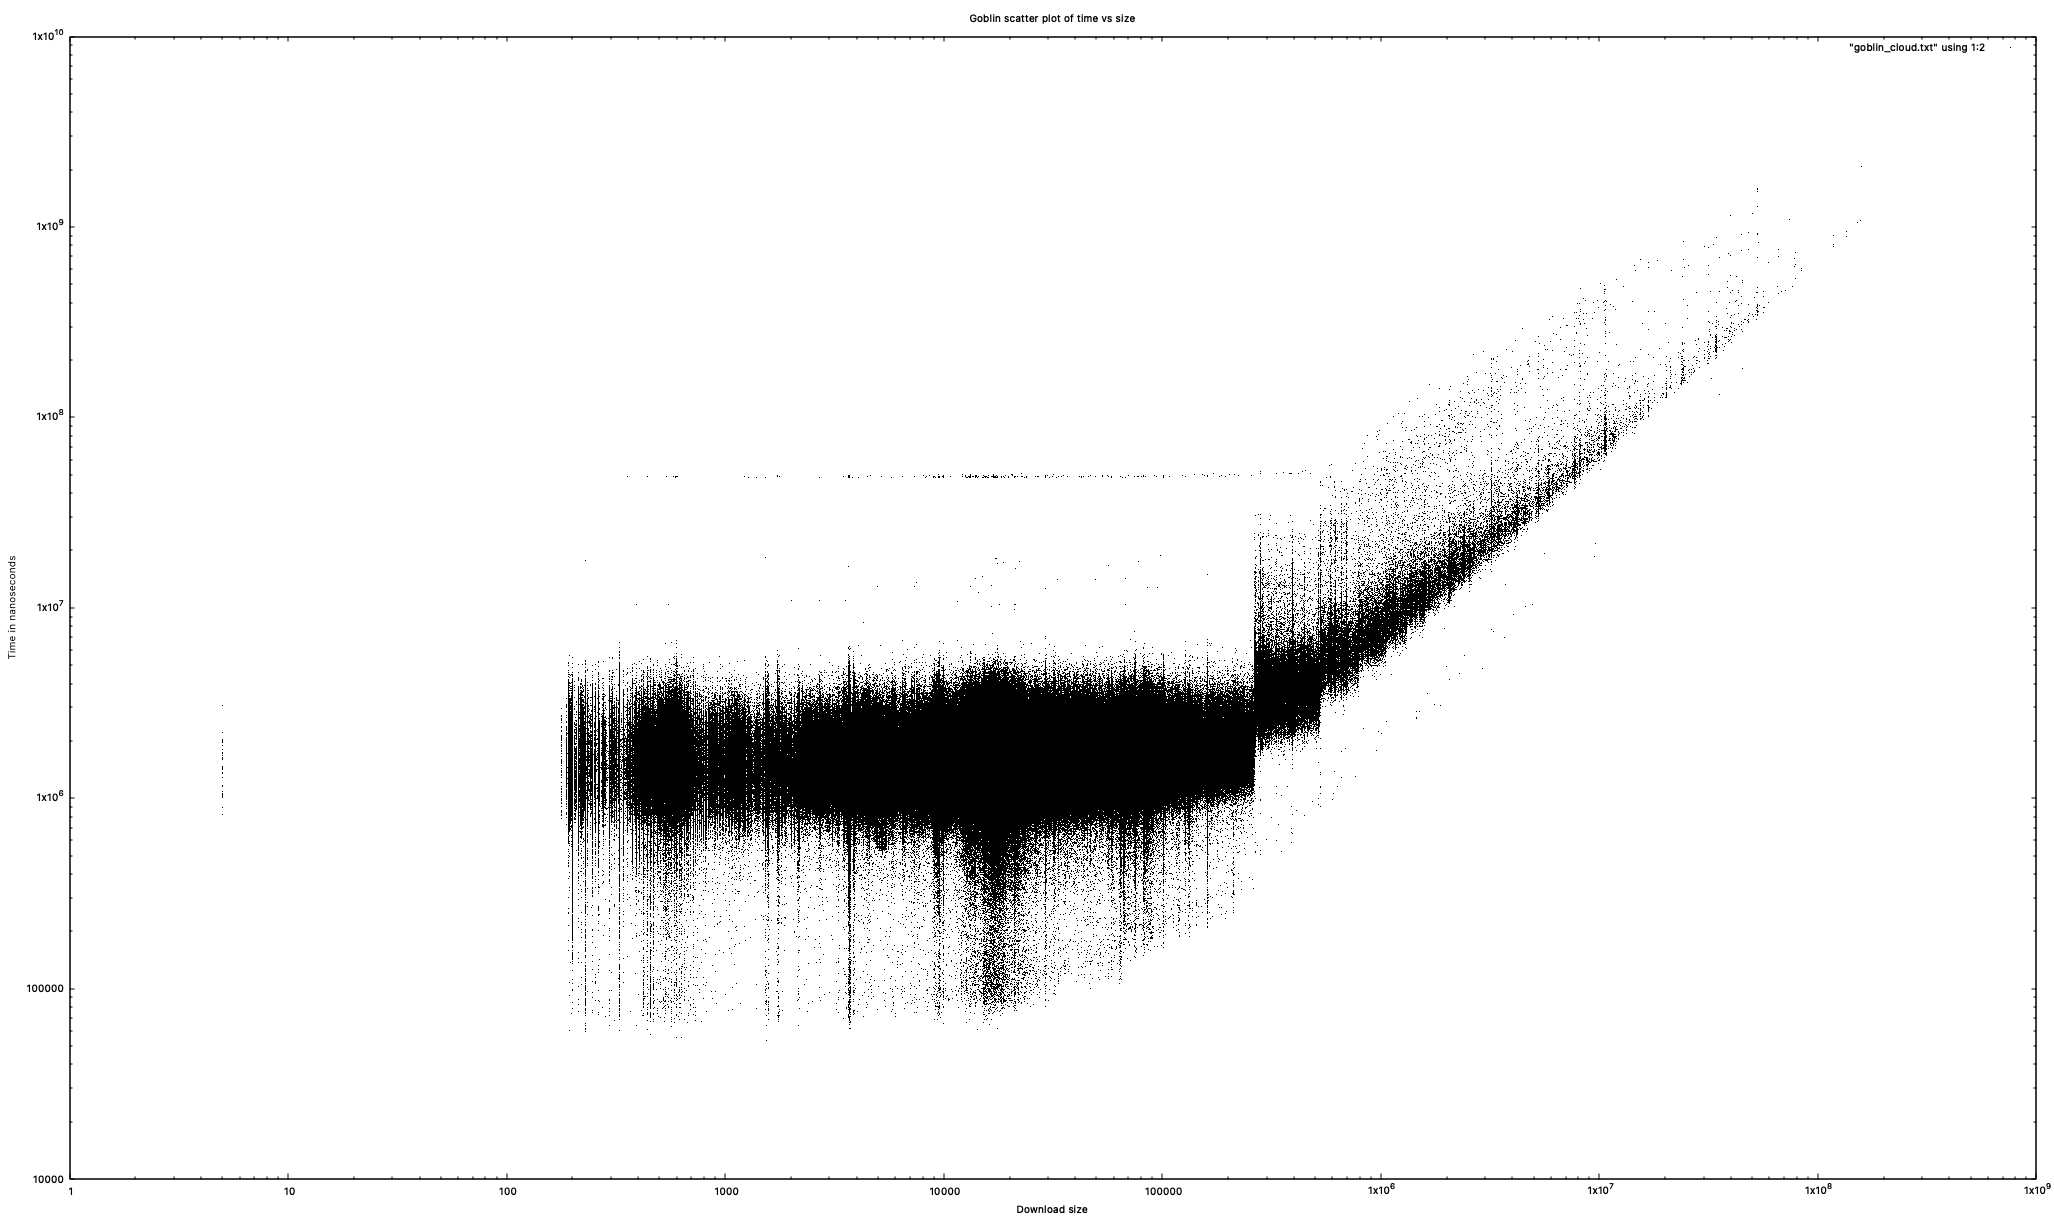
Goblin Store at C256. The common-size cloud is visibly shorter, and the 256 KiB head boundary appears as a marked elbow.
Goblin’s delivery-time cloud has less vertical spread than Vinyl’s across the common object-size range. The visual difference agrees with robust distribution measures for the 6,014,281 requests no larger than 256 KiB:
| Cache | Median completion time | MAD / median | p95 / p50 |
|---|---|---|---|
| Vinyl Cache | 1.459 ms | 27.8% | 3.25× |
| Goblin Store | 1.555 ms | 20.3% | 1.66× |
Vinyl has the slightly lower median—its median over the complete trace is 1.471 ms versus Goblin’s 1.568 ms—but Goblin is substantially more consistent where most requests lie. These timing distributions are strongly right-skewed and contain rare multi-second stalls, so standard deviation and coefficient of variation are dominated by outliers, especially for Vinyl. Vinyl recorded 24 requests of at least one second, with a 2.700-second maximum; Goblin recorded 10, with a 2.095-second maximum. MAD/median and p95/p50 better describe the dense body of this distribution.
Goblin’s marked elbow at 256 KiB reflects its configured head size. Responses at or below that
boundary complete entirely from resident memory. For a larger response, Goblin begins the
asynchronous O_DIRECT Optane read when it starts transmitting the in-memory head; after the
256 KiB head has been delivered, request completion depends on the tail arriving from that read.
The elbow is thus the boundary between memory-only completion and the asynchronous direct-I/O tail
path, not the instant at which the tail read is submitted.
Large-file behavior should be analyzed separately: both the performance curve and tail behavior change sharply above the head boundary, and each trace contains only 20 observations above 64 MiB. That sample is too sparse to characterize the extreme large-object distribution from these plots.
Interpretation and limits
This experiment characterizes a useful shape:
- Goblin’s empty-cache miss/admission path is the largest win: approximately twice Vinyl’s fill bandwidth on this corpus.
- In a fully populated cache, Goblin’s advantage is broad rather than confined to one concurrency. Its peak is 14.1% higher, and its relative advantage grows again when connection counts become excessive.
- A 256 KiB resident head is generous for this distribution. Nearly 98% of measured accesses are completely resident, while the long object tail still exercises direct Optane reads.
- The 72-loop, three-node client has substantial CPU headroom. The observed throughput knee belongs to the cache/loopback/NUMA system under test, not to a client pinned on one socket.
The scope is deliberately narrow. Local TCP loopback avoids a physical NIC and makes this a cache and NUMA scaling test, not an end-to-end network result. Server and client share one kernel and one memory fabric. Each row is a single complete trace rather than a replicate, and Vinyl always ran before Goblin. The experiment does not establish behavior for another object-size distribution, head size, processor generation, SSD, kernel, or a remote client.
Reproduction
The repository-side machinery is:
bench/run_optane_local_numa_concurrency_pair.sh— matched lifecycle, placement, trim, and concurrency sweep.bench/run_optane_vinyl_baseline.shandbench/run_optane_goblin_baseline.sh— cache-specific population and validation.bench/mirror_proxy_benchmark.cpp— shared-queue io_uring client and nanosecond trace capture.bench/monitor_benchmark_resources.py— process, system, pressure, and per-node monitoring.
The fixed population and measured manifests had SHA-256 values
76d8a26ddda037bde40f2fb7dc7bb9d012ce9815c06404676020998bd2ebb0da and
1492f5583999d3138ed03c35a85f5f0155ee5b19b9ccd0143c76800ae6403590, respectively.
Data attribution and license
This benchmark corpus is an adaptation of:
Špaček, Stanislav; Velan, Petr; Čeleda, Pavel; Tovarňák, Daniel (2022). Encrypted Web Traffic Dataset: Event Logs and Packet Traces. V1. Science Data Bank. https://doi.org/10.57760/sciencedb.01676.
The source dataset is licensed under the Creative Commons Attribution 4.0 International license. We made the following changes for this benchmark: selected host-name/size/access-order metadata from an event-log-derived file; replaced host names with opaque numeric IDs; generated new random payload bytes at the derived object sizes; and converted the access sequence into population and measured HTTP manifests. This report and generated benchmark corpus are not endorsed by the source authors or Science Data Bank.